Analytical Methods
Over the past two centuries, the science of chemistry, physics, biology and geosciences have made tremendous advances in the development of analytical techniques for understanding the physical world. Many of these techniques are based on how electromagnetic radiation interacts with matter. Electromagnetic radiation may be absorbed, transmitted, reflected, refracted, and so on. These phenomenon can be detected, quantified and analyzed to determine such information as elemental and chemical composition, crystal form, age, and more. But these techniques are not a black box where a definitive answer to specific questions, such as, 'Is this a van Gogh', can be obtained. Rather, such analyses are pieces of a larger puzzle that must be put together carefully and scrutinized for consistency. These data must also be interpreted in the light of Art History and the stylistic profile of a particular artist or time period. It is easier to prove that an object is a fake that it is to prove that it is authentic, and the answers to these questions can change as new analyses and data become available.
It is the goal of this page to provide a simple introduction to the analytical techiques that conservation scientists and art conservators use to probe the objects they work with and the types of information that can be obtained from these analyses.
The wavelengths (700 nm to 1 mm) of infrared radiation (IR) are not detectable by the human eye and lie just outside the visible region next to red light. Infrared radiation is also known as heat radiation and can be detected by night vision goggles. IR wavelengths have energies ranging from 1.7 eV (2.7 × 10⁻¹⁹ J) to 1.24 × 10⁻³ eV (2.0 × 10⁻²² J). Infrared radiation has the same frequencies as the vibrations of bonds in compounds and molecules and so the absorption spectrum of infrared light is typical of the types of bonds present.
Molecular vibrations can be treated as if the atoms are balls attached to springs tht are approximated as harmonic oscillators. The energies of the vibrations are inversely proportaional to the square root of the reduced masses of the atoms, where the reduced mass, μ, is defined as μ = 1/(m1-1 + m2-1), where m1 and m2 are the masses of the two atoms. For our purposes, this means that infrared radiation is able to determine the identity of compounds and molecules by giving information about the bonds present. In order for a particular bond vibration to be detected by IR spectroscopy, the molecule must undergo a change in dipole moment as the bond vibrates. A related technique known as Raman spectroscopy detects vibrations that cause a change in the polarizabilty of the molecule.
Infrared Spectroscopy
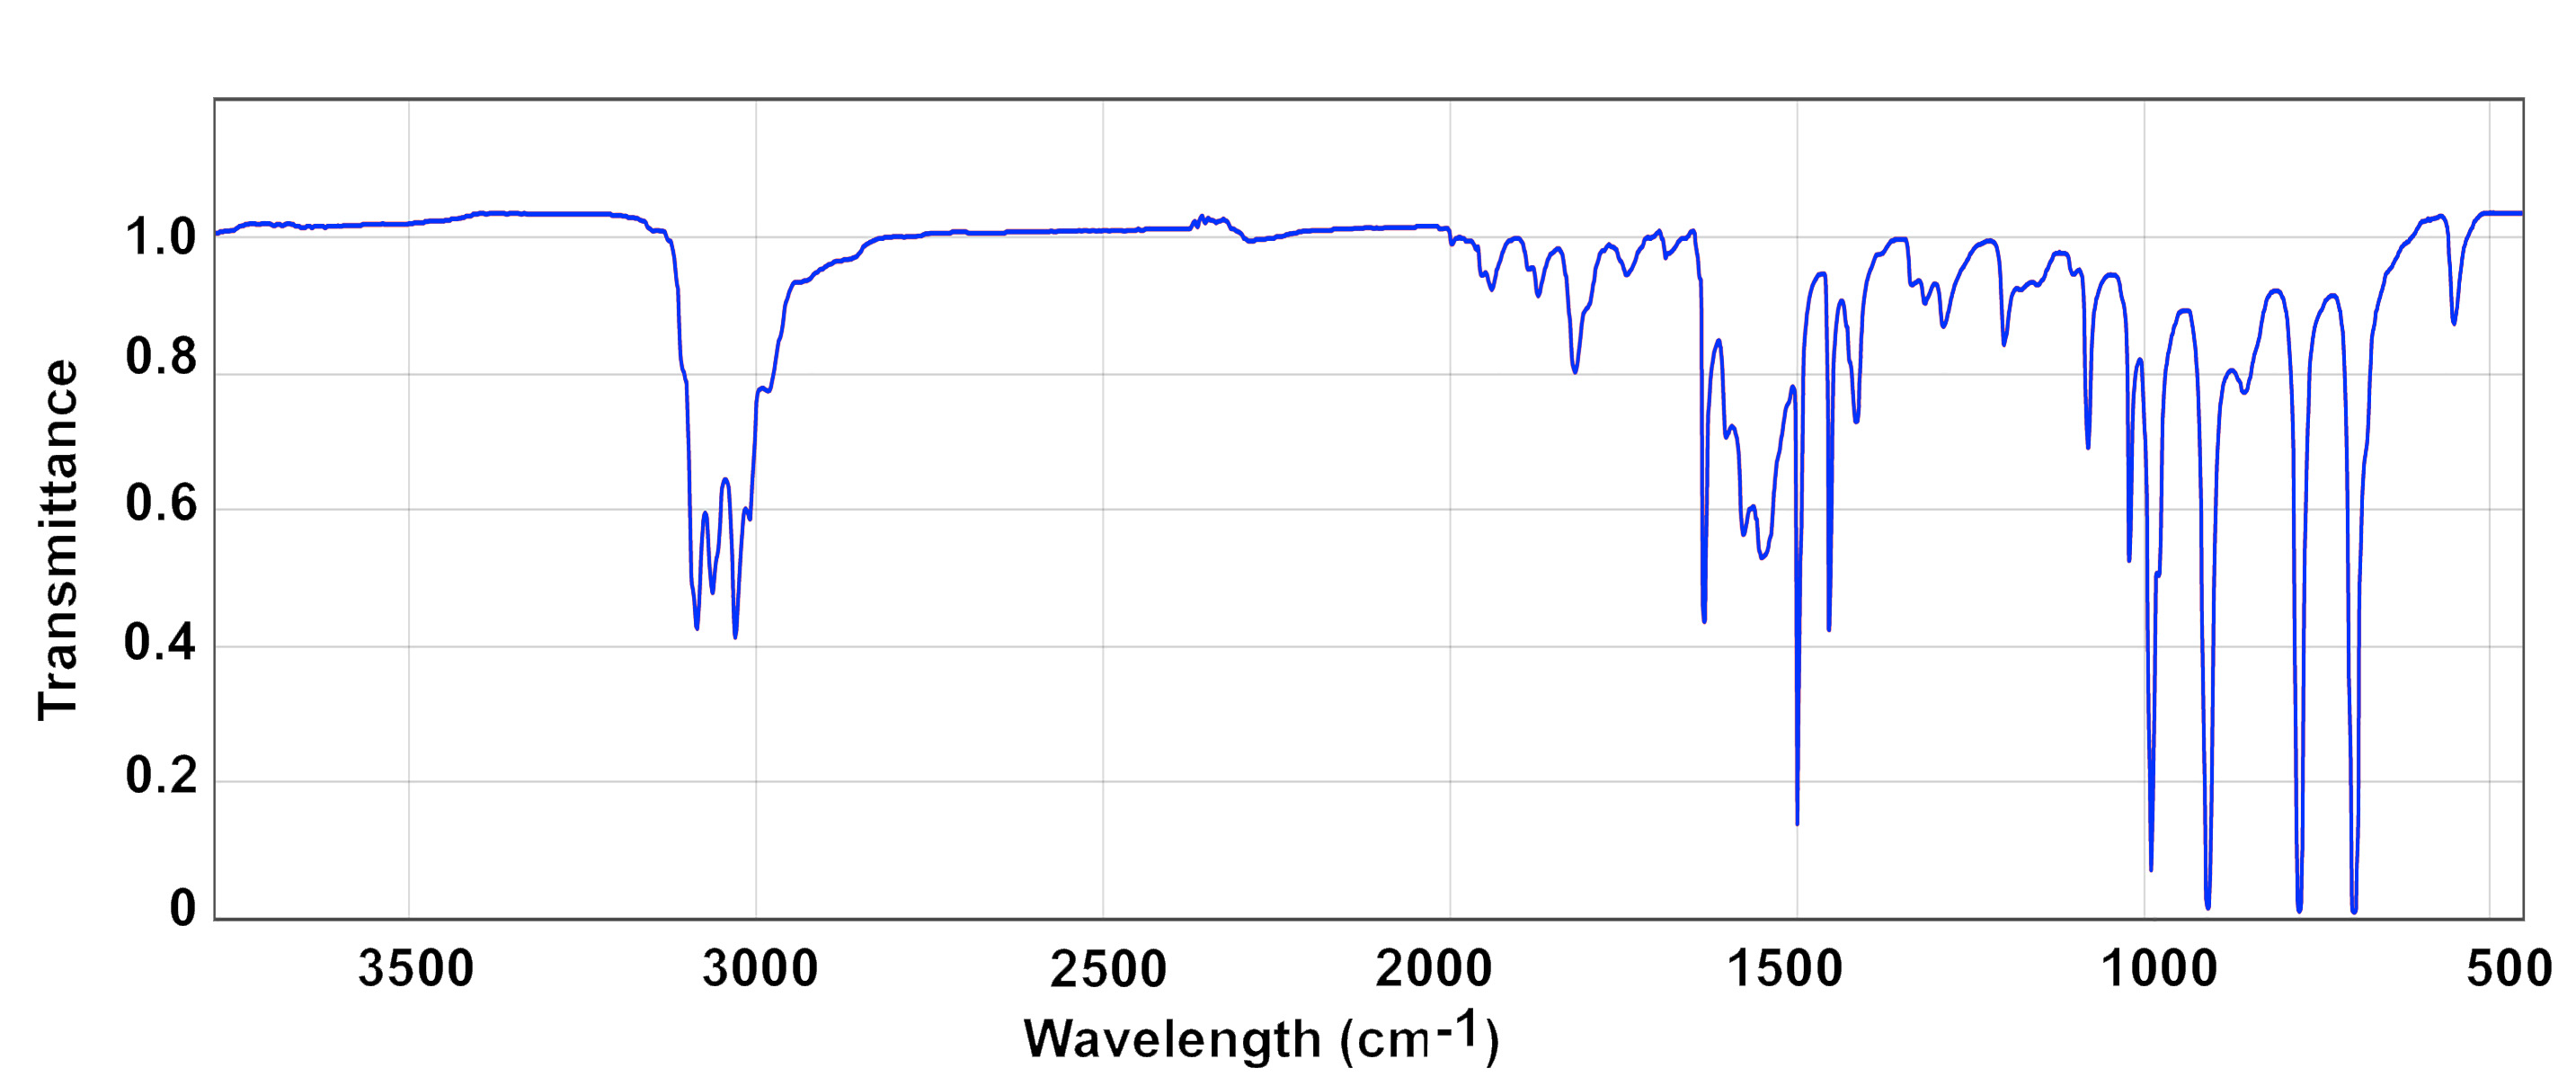
Many molecules are easily studied by infrared spectroscopy. In comparison to many other types of analytical instrumentation, IR spectrometers are relatively inexpensive. A beam of IR radiation is focused on a sample and the absorbed light is analyzed by a detector. This may be done either by absorption of the radiation during transmission through the sample or reflection off of the sample's surface (attenuated total reflectance, ATR). IR spectroscopy can be done on samples that are gases, liquids or solids. It is common to take spectra of solids or liquids dissolved in a solvent. Solids can also be ground into a fine powder mixed with potassium bromide and pressed into a pellet or mixed with Nujol (mineral oil) and spread on a transparent salt plate of sodium chloride or potassium bromide. This is also referred to as a Nujol mull. The advantage of using potassium bromide is that it has no absorbances from 4000 to 400 cm-1, which is known as its spectral window, and therefore will not interfere with absorbances from the sampel. Nujol is an organic molecule but it has only a few absorbances that are readily identifiable and these occur in places that are generally not too valuable for an analysis (2950 - 2800 cm-1, 1465 - 1450 cm-1, 1380 - 1300 cm-1). IR absorbance can also be used to determine the concentration of a substance in a solution as the absorbance, A, is proportional to the concentration, C, the pathlength, ℓ, and molar absorptivity, ε, of compound by the equation A = ε × C × ℓ. Transmittance can also be used as A = - log10[T/T0], where T0 = 100%, but most infrared spectrophotometers will readily switch between giving the data in either asorbance and transmittance modes.
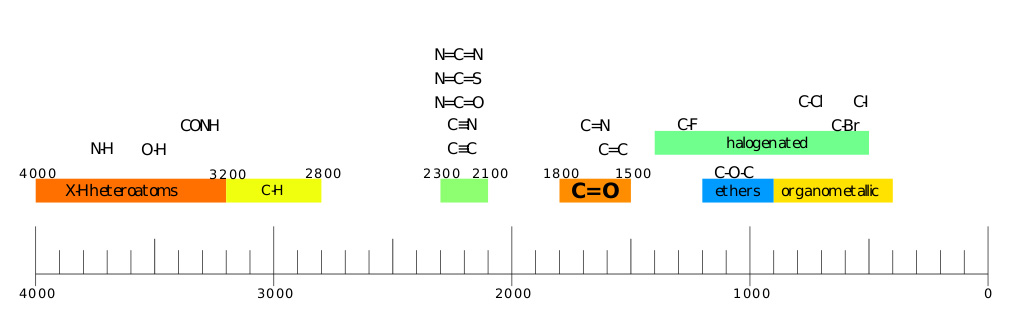
There are usually a number of infrared bands in a particular compound and, in principle, these could all be individually attributed to particular bonds in the molecule. To do a full analysis of every bond in a molecule, however, is very time connsuming and often not particularly interesting. In practice the technique is more often used to identify particular types of bonds that lie in characteristic regions of the IR region or are used as simple fingerprints, meaning that the compound is identified by comparison to a database of infrared spectra of known materials.
Infrared Spectroscopy, Faverik, CC BY-SA 4.0
The vibrations between most metals are, therefore, at low frequencies and lie in or close to the far IR region of the spectrum, often below 800 cm-1. Most common IR spectrometers do not measure below 400 cm-1 and measuring those bonds must be done on a special instrument that has the appropriate spectral window and where the sample compartment can be purged with nitrogen to eliminate interferences. Raman spectrometers, however, are more useful for measuring vibrations in the energy range.
Infrared Reflectography
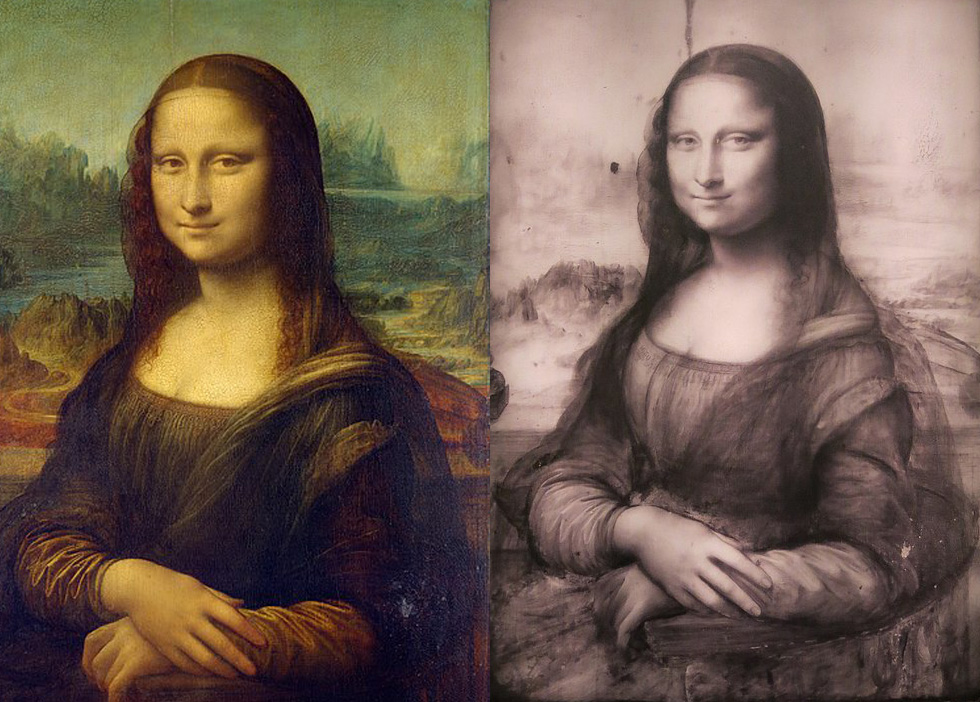
The Mona Lisa (left), Leonardo da Vinci, Public domain, via Wikimedia Commons, and its Infrared reflectance image (right), Tangopaso, Public domain, via Wikimedia Commons.
Infrared reflectography looks at an object from the total infrared radiation absorbed rather than looking at the absorbance as a function of wavelength. This technique is most often used to identify underdrawings in paintings that were done with charcoal, as carbon-based materials absorb infrared radiation strongly.
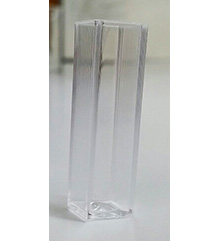
Cuvette for measuring UV-vis spectra, taken from Ittarusp, CC BY-SA 4.0
Visible light is the radiation source by which we normally interact with Art, as this is the radiation that activates our detection system, the human eye. It is understandable that our eyes would develop to see visible light as it is the major component of solar radiation (see below). Other animals and insects have eyes that detect different regions of the electromagnetic spectrum. Bees like many insects, for example, see ultraviolet light. Dogs see only limited color as they only have red and green cones, unlike humans who have red, green and blue. Visible light lies in the range of 400 nm to 750 nm and it causes electrons to move from one orbital to another on the molecule in a process known as an electronic transition. Ultraviolet light may also cause electronic transitions, and often spectrometers designed to measure visible spectra will also measure UV absorptions. Consequently, these instruments are generally called UV-vis spectrophotometers, and together these constitute the field of electronic spectroscopy. Sometimes the transitions that take place in the UV region are so intense that the absorption bands tail into the visible spectrum causing the compounds to have color. Normally visible spectra are obtained by placing solutions of the sample in glass or plastic cuvettes. These are small, test tube-like glass containers that have a square cross section providing a 1 cm-1 pathlength.
.png)
The solar spectrum, Danmichaelo, Public domain, via Wikimedia Commons.
Visible Spectroscopy
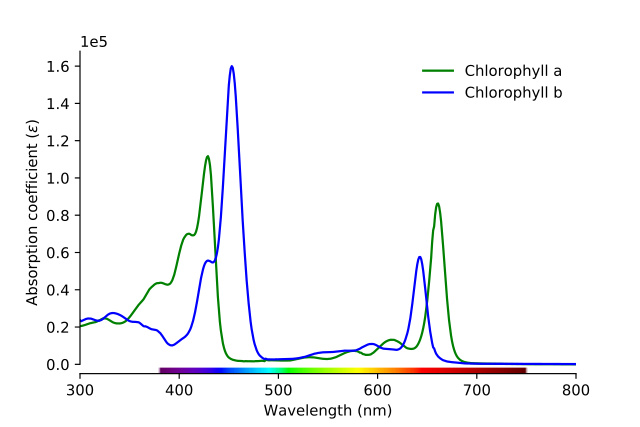
Chlorophyll Absorption Spectrum showing the absorption bands of chlorophylls a and b, Serge Helfrich, CC BY-SA 4.0
As with infrared spectroscopy, instruments with detectors that can sense visible light are also known. Instruments have been developed that can measure light intensity as a function of wavelength either in transmission or reflectance modes. While the human eye is very good at distinguishing slight differences in color, it is not very good at determining the combination of wavelengths of light that went into making up that particular color. Even though two different paints may look the same color initially, if composed of different pigments, they may not age the same. This is noticeable in some restorations where the colors initially matched but later looked different because aging of the added paint changed its color over time. Instruments are far better at analyzing color reproducibly and are used extensively in the pigments and paints industry for ensuring that different batches of a particular pigment or mixtures of pigments meet specifications.
Raking Light
Raking light is a simple technique in which visible light is focused on a object from an oblique or grazing angle. This highlights the surface texture of the object and it is particularly effective at delineating the brushstrokes of painters, especially those that used impasto techniques such as van Gogh.
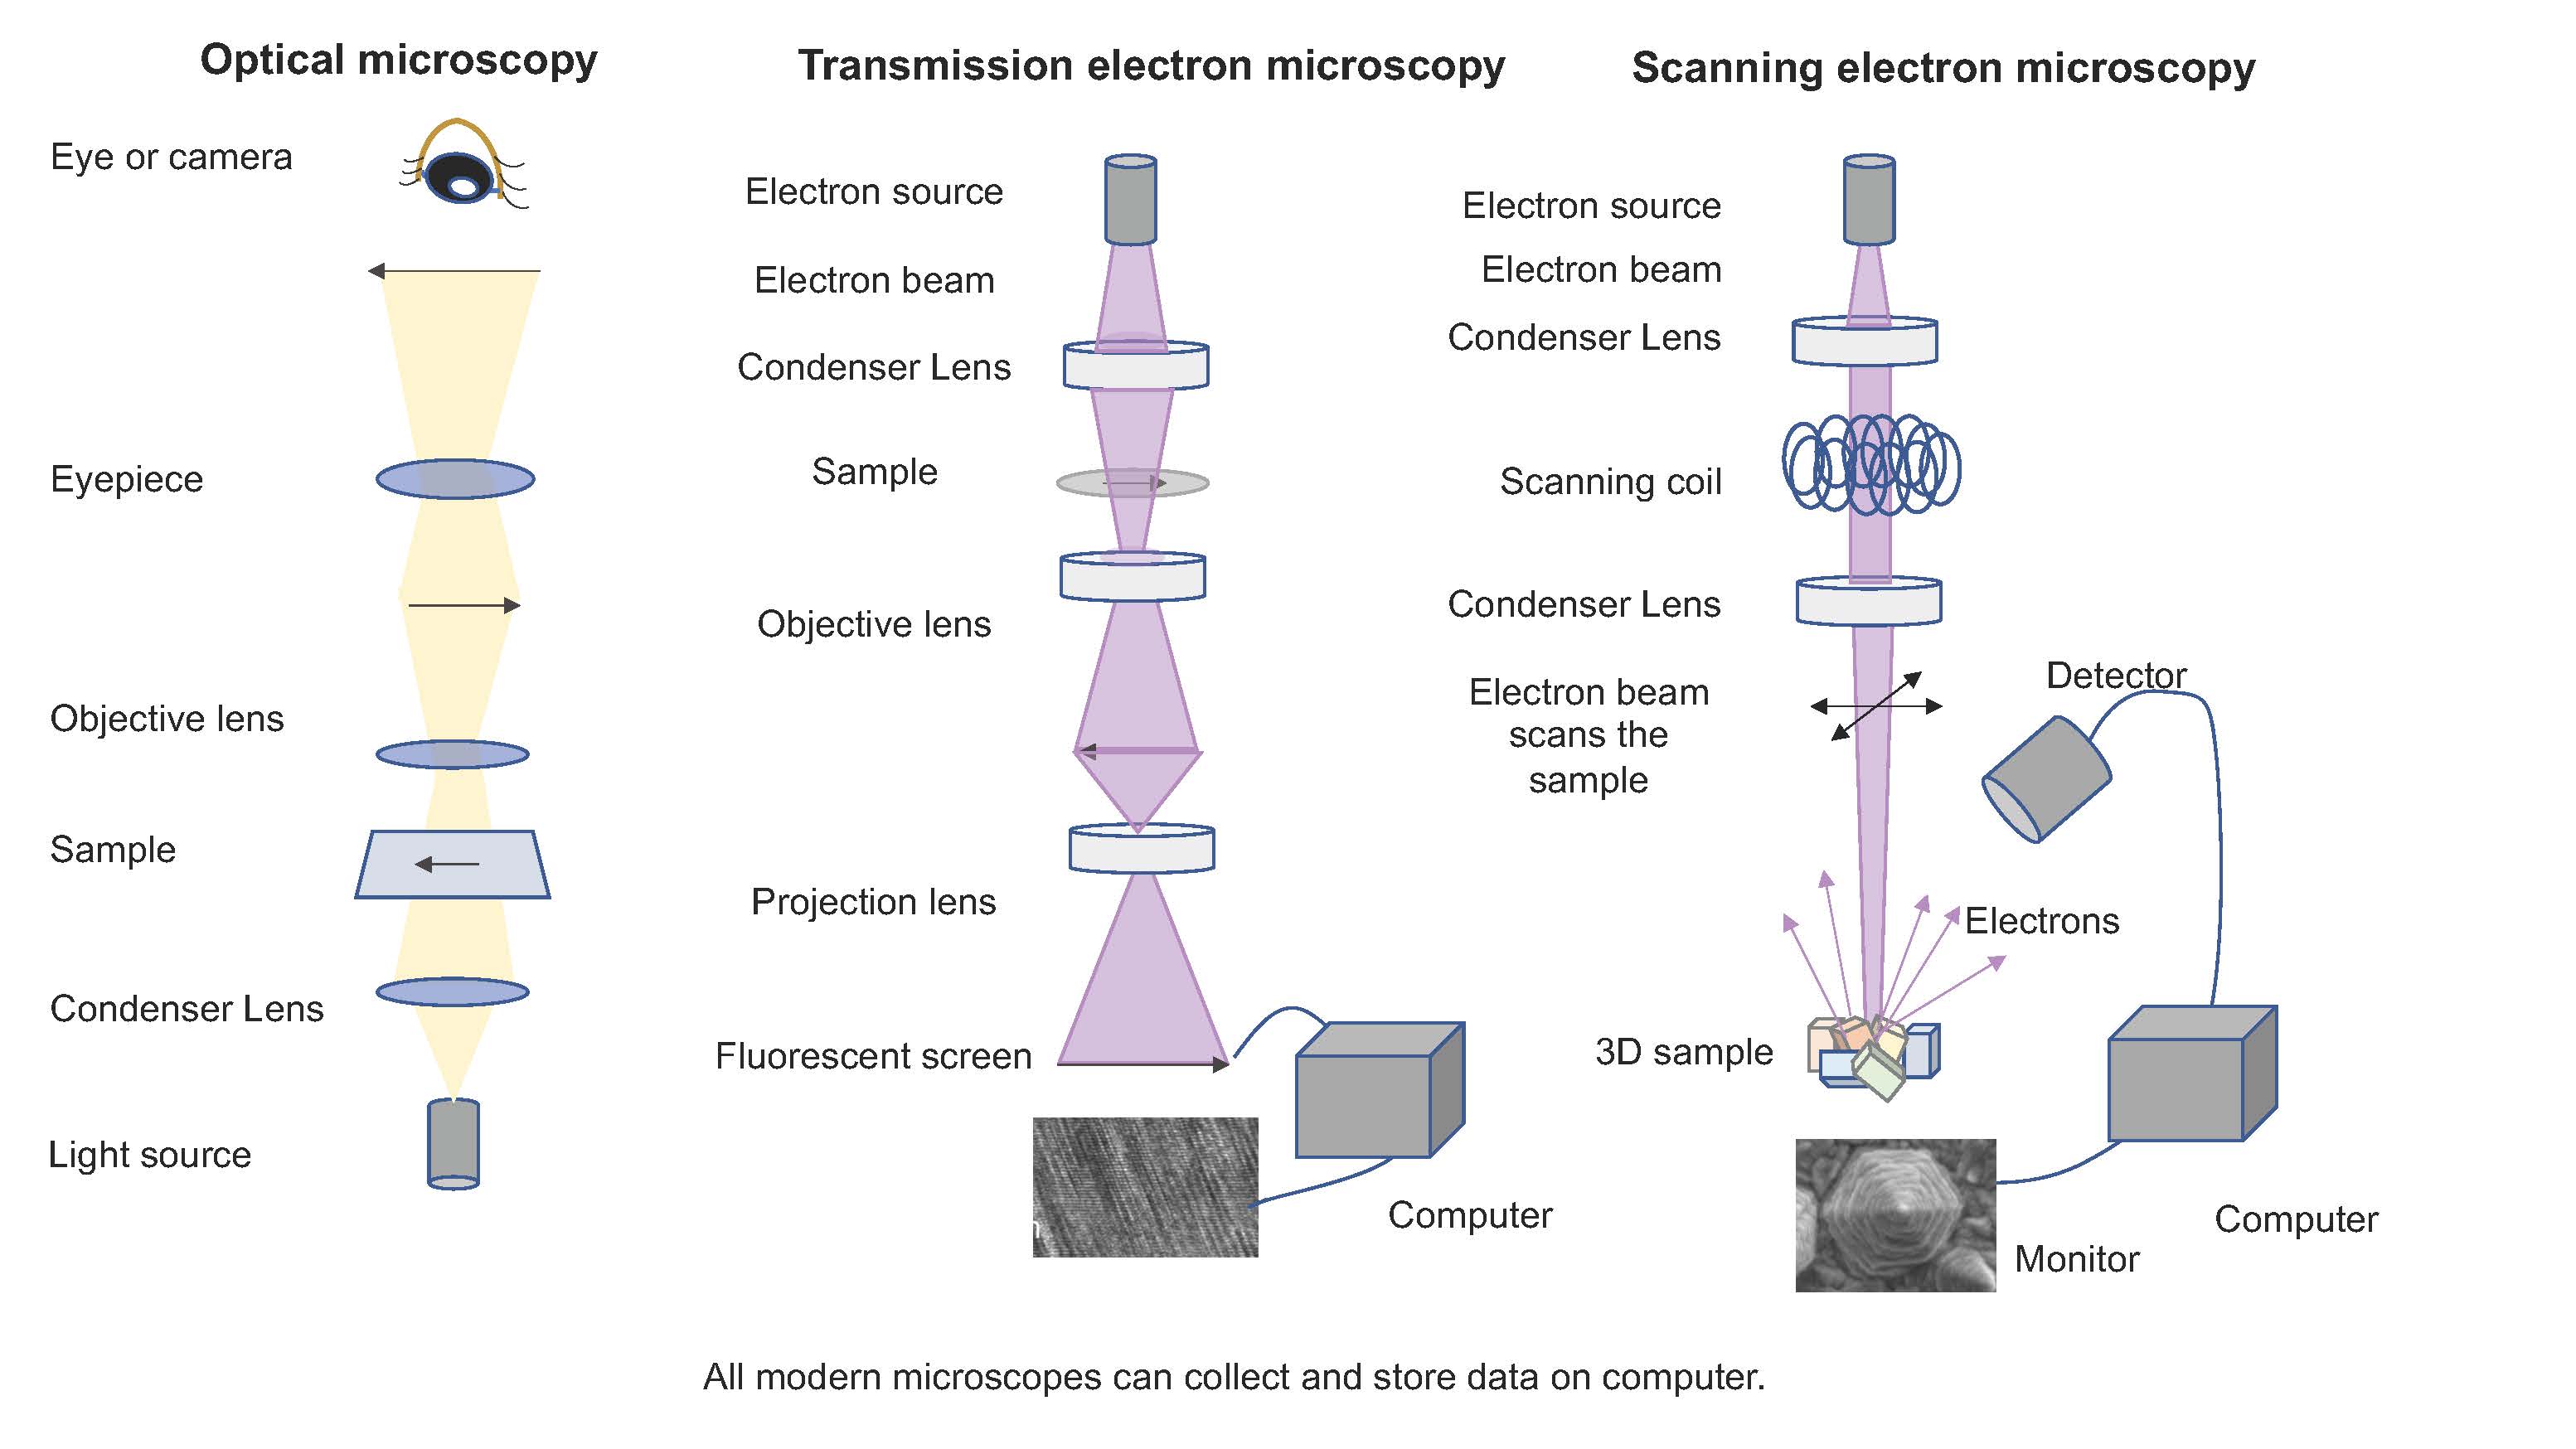
One of the oldest techniques for examining art objects, or samples taken from them, is by microscopy. Microscopies of all kinds focus electromagnetic radiation on a sample and make use of lenses to enlarge the image for easier viewing. The eariest form of microscopy used visible light and glass lenses to achieve the modification, while in the past fifty years, microscopies using beams of electrons have also been developed that greatly extend the magnification range achievable.
Optical Microscopy
Optical microscopy which uses lenses to magnify visible light images dates from the early 1600s. Over the centuries, the designs of these simple units has been improved to the point that magnifications up to about 1000x are achieved. Modern instruments can also be interfaced with cameras so that the images can be captured, stored and processed. One simple modification of optical microscopes uses polarizing filters. Some crystalline samples show interesting color changes as they are rotated in a field of polarized light, which helps to identify the types of crystal phases present when coupled with the shapes of those crystals.
Electron Microscopy
UV Spectroscopy
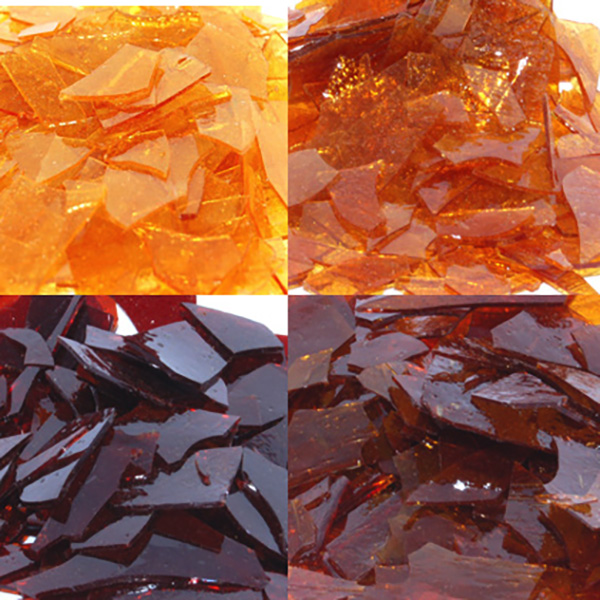
Ultraviolet spectroscopy is similar to visible spectroscopy in that also is the consequence of electrons changing energy levels in molecules, although these transitions are higher in energy than those in the visible spectrum. In the UV, these types of transitions are often associated with the presence of multiple bonds and aromatic systems. As seen on the pages for inorganic pigments and organic pigments, there are a variety of chromophores that can result in the creation of color. The transitions that occur in the UV region can be very intense and, even thought the maximum absorption is not visible to the human eye, these are often so intense that some absorption also tails into the visible region. This often result in compounds that are yellow or orange. Unlike visible spectra that can be measured in plastic or glass cuettes, UV spectra must be obtained in special quartz cuvettes as common glass and plastics absorb strongly in the UV region. UV-vis spectrophotometers also are equipped with two different light sources - one for visible and one for UV, so that a change in light source is often required to meausure the UV region.
X-rays are high electromagnetic radiation with wavelengths ranging from about 10 pm to 10 nm, which corresponds to about 124 eV (~12,000 kJ·mol-1) to 124 keV (~12,000 MJ·mol-1). X-rays are highly penetrating meaning that they substantially pass through most materials. They have sufficient energy to cause the reduction of silver halides in a photographic film, and this was soon utilized for medical diagnostics soon after their discover by Wilhelm Röntgen in 1895.
There are several analytical methods used in the study of Art objects that are based on X-ray radiation. This include simple absorption of X-rays, as in a medical X-ray, X-ray fluorescence and X-ray diffraction.
X-ray Absorption
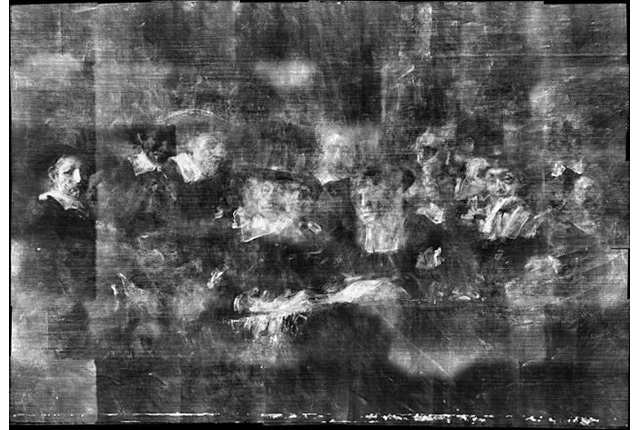
X-ray absorption is one of the simplest techniques using X-rays. When X-ray radiation is focused on an object much of the radiation passes through but some will be absorbed. If a photographic film or an X-ray-sensitive detector is place on the opposite site of the object from the X-ray source, an image of those areas of the object that absorb X-ray will be produced. This is well-known in medicince to detect broken bones, but in Art it can be used to detect the wooden frame that supports a canvas painting or areas of pigments that contain heavy metals such as lead or mercury, which asbsorb X-rays strongly. As seen in the images of the Syndics of the Drapers' Guild by Rembrandt and its X-ray absorption study, Rembrandt had earlier versions of the composition before settling on the final image.
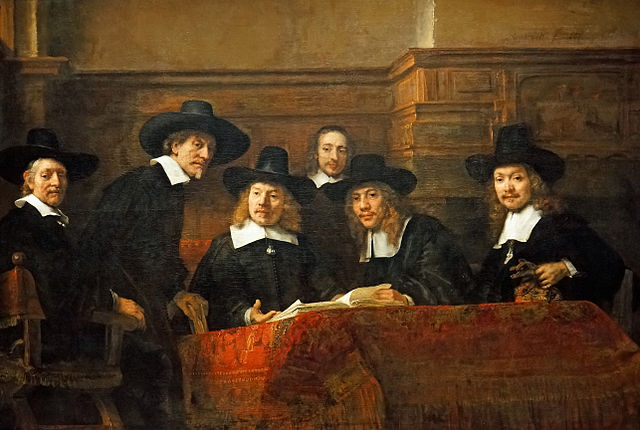
The Syndics of the Draper's Guild by Rembrandt, Public domain, via Wikimedia Commons.
X-ray Fluorescence Spectroscopy
X-ray fluorescence scan, LinguisticDemographer at English Wikipedia, Public domain, via Wikimedia Commons.
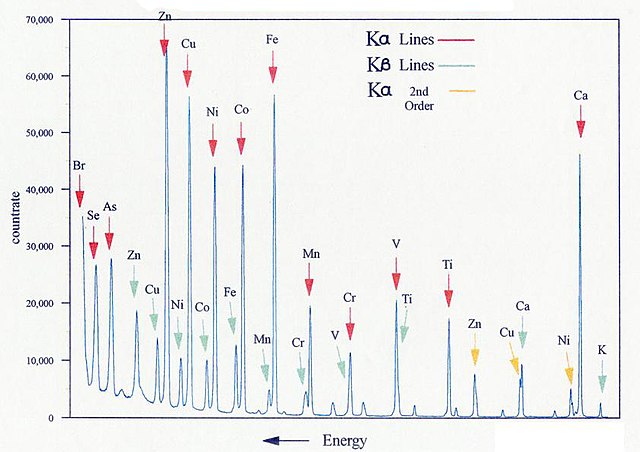
X-ray fluorescence (XRF) spectroscopy makes use of the absorption of X-rays in a different way to determine the elemental composition of a sample. When X-rays strike atoms, whether in the elements, compounds or molecules, some of the X-rays may cause electrons to be ejected from those atoms from any of their atomic orbitals. This results intially in those atoms being in unstable high energy states and very quickly electrons that are in higher energy orbitals will move into those vacated orbitals with lower energy in order to restore the lowest possible electronic configuration energy. This process is accompanied by a loss of energy as a photon in a process known as fluorescence. For any element there may be several fluorescence peaks, and these are characteristic of the element from which they arise, as shown in the figure. Since there is overlap between some of these peaks, the interpretation of XRF data must be done carefully to void misassigning the elemental composition. The benefit of XRF is that it is a nondestructive - it does not require removing a any sample from the object. A limitation of XRF is that it is not useful for determing the presence of lighter atoms such as carbon or nitrogen. XRF technology has advanced to the point that small handheld units are commercially available, although not inexpensive, that make it relatively easy to determine the elemental composition of a sample within minutes. More advanced applications allow for rastering, which involves slowly passing the XRF unit across a 2-dimensional sample in much the same way that an inkjet printer prints a document. Data are thus collected that give a detailed image of the object across the entire object rather than in a point location.
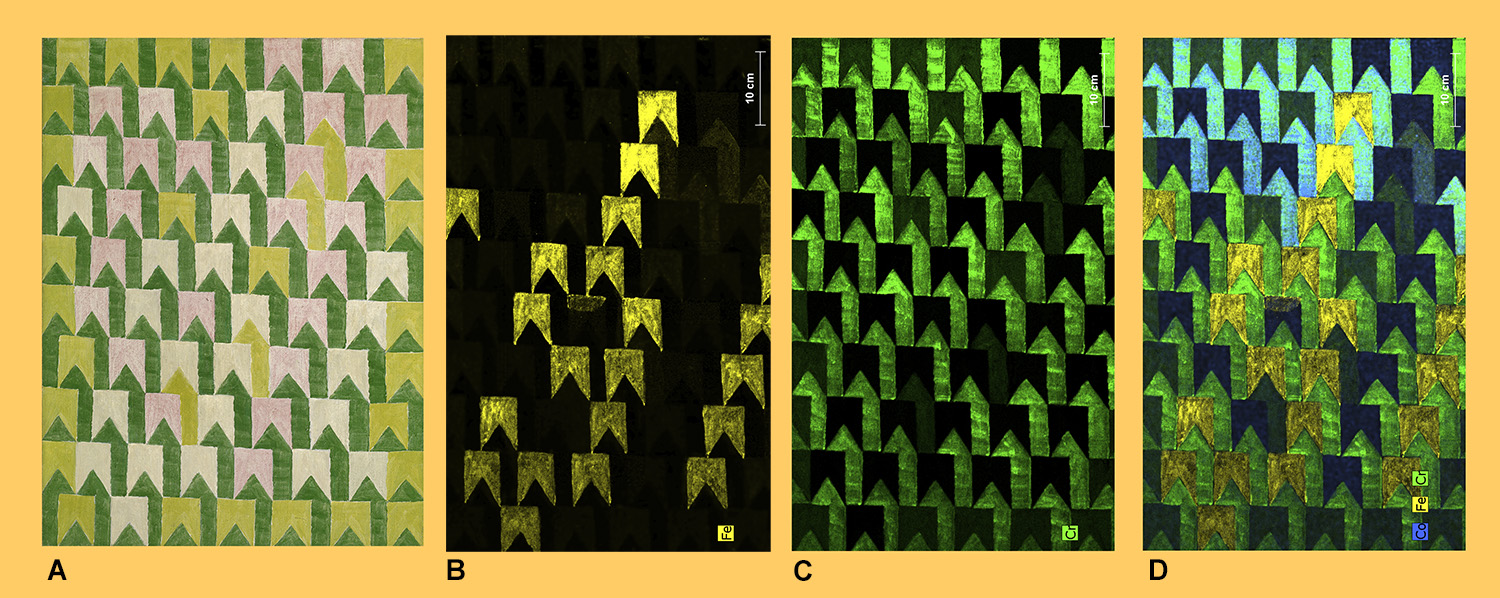
(A) Bandeiras, by Alfredo Volpi, (Brazilian, born Italy, 1896–1988), 1960, tempera on canvas, The Adolpho Leirner Collection of Brazilian Constructive Art, museum purchase, Museum of Fine Arts Houston. XRF data for the painting showing areas containing iron (B) or chromium (C). (D) A Composite image of the overlay of the XRF data for cobalt, iron and chromium. XRF images courtesy of Corina Rogge, Ph.D., Andrew W. Mellon Research Scientist, Museum of Fine Arts Houston and the Menil Collection.
X-ray Diffraction
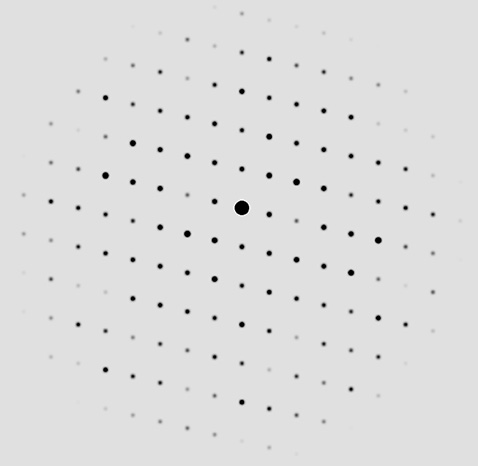
A simulated single crystal X-ray diffraction pattern for Dravite (Tourmaline). Diffraction image simulated using the program Single Crystal v.4.1.4, © 1995 -2021, Crystal Maker Software.
In addition to absorption and fluorescence, X-rays are diffracted by crystalline materials. This process is analogous to that of passign light through a set of slits. In the case of crystalline materials, the "slits" are the regular repeating arrangements of the electrons surrounding the atoms in a crystal. According to our understanding of quantum mechanics, electrons have wave properties just as electromagnetic radiation does and these waves interact to form an interference pattern that can be analyzed to provide the size and shape of the crystal unit cell as well as the locations of the atoms of different types within that cell. These data can be measured either on single crystals or on powdered samples of crystals (powder X-ray diffraction or PXRD).
The regular patterns of diffraction peaks seen in the single crystal pattern is the related to the unit cell parameters (edge lengths and angles), while the intensities of the spots can be analyzed to determine the locations of the atoms in the crystal. Each of those spots represents diffraction from a particular set of equivalent lattice planes, and the more intense spots correspond to planes that have larger atoms with more electrons. A database of powder XRD spectra are now available for a large variety of minerals, gems and other solid materials and the composition of an unknown sample can be readily determined by matching in the database. This process is made easier if a rough idea of the composition of material is known, such as the elemental composition provided by XRF spectra.
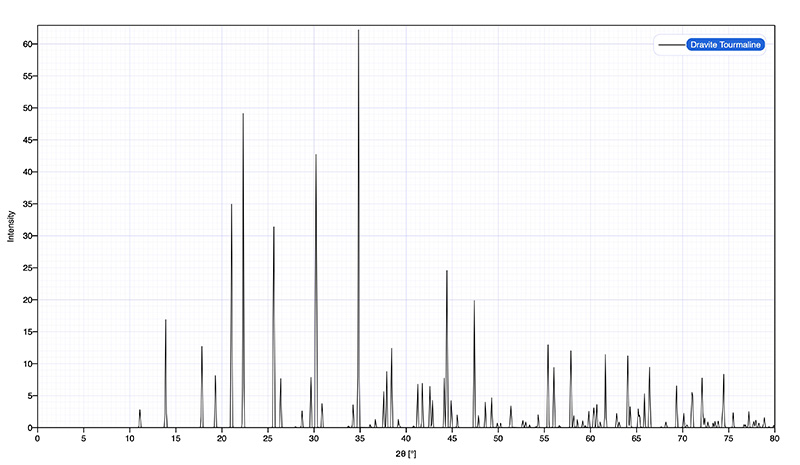
A simulated powder diffraction analysis of Dravite (Tourmaline) created using the program Crystal Diffract v.6.9.2, © 1995 -2021, Crystal Maker Software. The intensities are shown as a function of diffraction angle, 2θ.
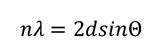
The diffraction peaks obey a mathematical relationship known as Bragg's Law, where d is the distance between the parallel planes of an equivalent set, n is an integer, and θ is the angle at which the X-rays strike the set of planes. This is illustrated in the diagram below. If the diffraction condition is not met, the X-ray components of the X-ray beam will be out of phase as they exit the crystal, resulting in destructive interference between the X-ray waves. As a result, no intensity is seen in those regions. When a beam of X-rays encounters a single crystal, diffraction spots are created in many different directions. Often, a large set of diffraction spots are measured by rotating the crystal in the X-ray beam.
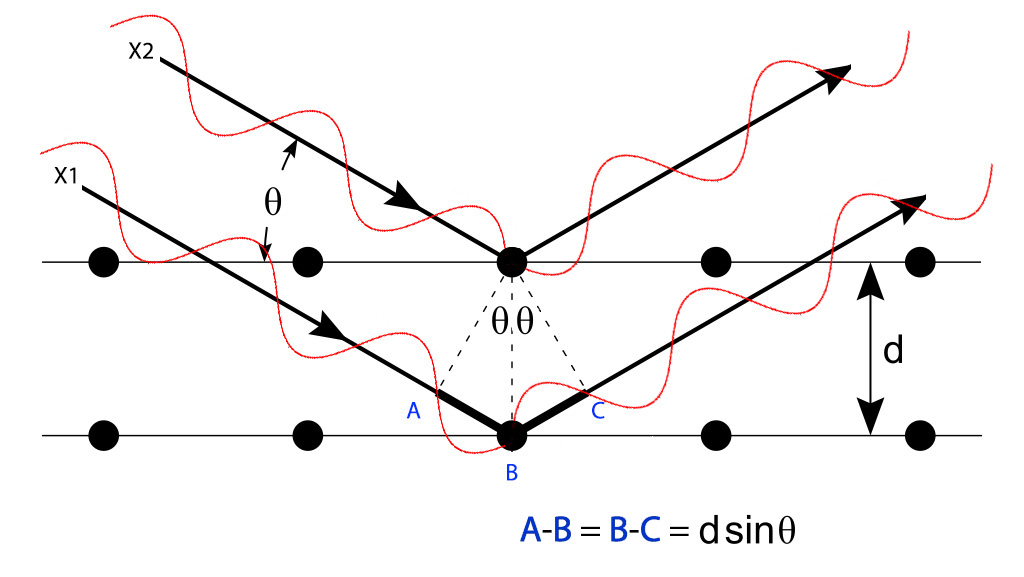
A diagram illustrating the origin of the Bragg diffraction relationship. Figure is a modification of the image Bragg diffraction by Hydrargyrum, CC BY-SA 3.0
Radioisotope dating is a method of determining the age of an object by looking at the ratio of isotopes present in an object. One of the most well-known isotopes studied and perhaps the most useful for determing the age of art objects is Carbon-14. Naturally-abundant carbon is composed mainly of three isoopes Carbon-12, Carbon-13 and Carbon-14. Of these only Carbon-14 has an unstable nucleus with half life of 5730±40 years. Carbon-14 is created in a steady state abundance by high energy radiation that creates neutrons in the upper atmosphere according to the equation:
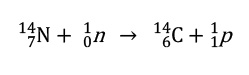
The carbon atom is converted back into 14N by β-decay in which a neutron in the nucleus of the carbon atom is converted into a proton plus an electron.
This radioactive carbon becomes incorporated into CO2, which is in turn incorporated into plants and the animals that eat them. The carbon-14 in plants and animals, thus, achieves a steady state concentration as long as the plant or animal is alive. Once it dies, however, the carbon-14 begins to decay. The age of the object can then be dated by the ratio of carbon-14 to to carbon-12 it contains. At one time, the levels of radioactivity were determined by measuring the decay events directly using a device such as a gieger counter and comparing the decay rate to a sample of known age, but later methods were developed using mass spectrometry in which a portion of the sample was volatilized and the ratios of the different isotopes present in the sample could be determined directly by the ratios of the signal intensities.
Other elements also have isotopes that can be used for dating rocks and inorganic materials. These methods often use two isotopes - the parent radioactive isotope as well as one of its decay products. These include the pairs of elements samarium-neodymium, potassium-argon, uranium-thorium, rubidium-strontium and uranium-lead.
Additional Resources
- X-ray Fluorescence, Wikipedia.
- Chemical Imaging of Works of Art at the Macro Scale: XRF Imaging Spectroscopy and XRD Scanning, National Gallery of Art, Youtube, Oct. 29, 2018.
- What is X-ray Fluorescene (XRF) and the Applications of XRF in the Elemental Analysis of Artwork, Maria Baias, Youtube, Aug. 27, 2020.
- Infrared, Wikipedia.
- X-ray Scattering Techniques, Wikipedia.
- X-ray Crystallography, Wikipedia.
- What is X-ray Diffraction?, Bruker Corporation, Youtube, May 29, 2019.
- Xray, Webexhibits.
- Girl with a Blog, by Abbie Vandivere, paintings conservator, Mauritshuis, Den Haag, the Netherlands. Various analyses of the Girl with a Pearl Earring by Johannes Vermeer.
- Art & Maps, Technical Photography comparing visible, polarized light, raking light, ultraviolet fluorescence, ultraviolet reflectance, infrared, infrared transmission, infrared fluoresence and infrared false color techniques.
- Techniques, Webexhibits. Includes information on Visible, UV, IR, X-ray, Microscopy, Sepctroscopy, 3D modeling, Dating and Tomography techniques.
- Radiometric Dating, Wikipedia.


.png)
References
- ***
- ***
Credits for the Header Image
- Infrared spectrum of stearic acid, crystals from a painting at the Rothko Chapel, Houston, TX, by K.H. Whitmire, sample courtesy of the MFAH.
- Infrared Reflectogram of the Mona Lisa, Tangopaso, Public domain, via Wikimedia Commons.
- Calculated diffraction for the mineral lazurite, or lapis lazuli, that is used as the pigment known as ultramarine.
Department of Chemistry
![]()
Houston, TX
6100 Main St., Houston, TX 77005-1827 | Mailing Address: P.O. Box 1892, Houston, TX 77251-1892 713-348-0000 |